# Quicktrends
The Quicktrends feature allows you to **measure and/or compare the volume of X (former Twitter) mentions** of different topics (up to 12 different topics) since 2006, over a maximum of 356 days.
➡️ You can access this feature by clicking on the quicktrends tab in the main menu.
### Use the same language than with a **X (former Twitter)** query
In quicktrends, you are able to use all the operators that are available for retroactive data recovery. You can find the [QuickTrends operators list](https://help.visibrain.com/~/revisions/Sg0jEnRI9hg61KE4OFRP/useful-documents/quicktrends-operator-list) in the section *Useful Documents*.
Click on the ***Update*** button to display your graphs.
### Save and import your queries
By clicking on the timeline menu in the upper right corner, you can save a query if you want to use it later with the **Save Rules / Load Rules** controls.
### Add up to 12 timelines
Click on the button ***Add Timeline*** to add a unit.
Click on the menu in the upper right corner of a timeline and on ***Delete*** to delete a unit.
### Personalize your timelines name
You are able to name your timelines as you want. By default, they are named according to the first rule of your unit. By clicking on their title, you will be able to customize them.
### Analyze your datas on a 356 days period
You can analyze up to 356 days of datas, on the period you want between 2006 and today.
The choice of the period is made as in the EXPLORE tab, by clicking on the calendar in the upper right corner of the platform.
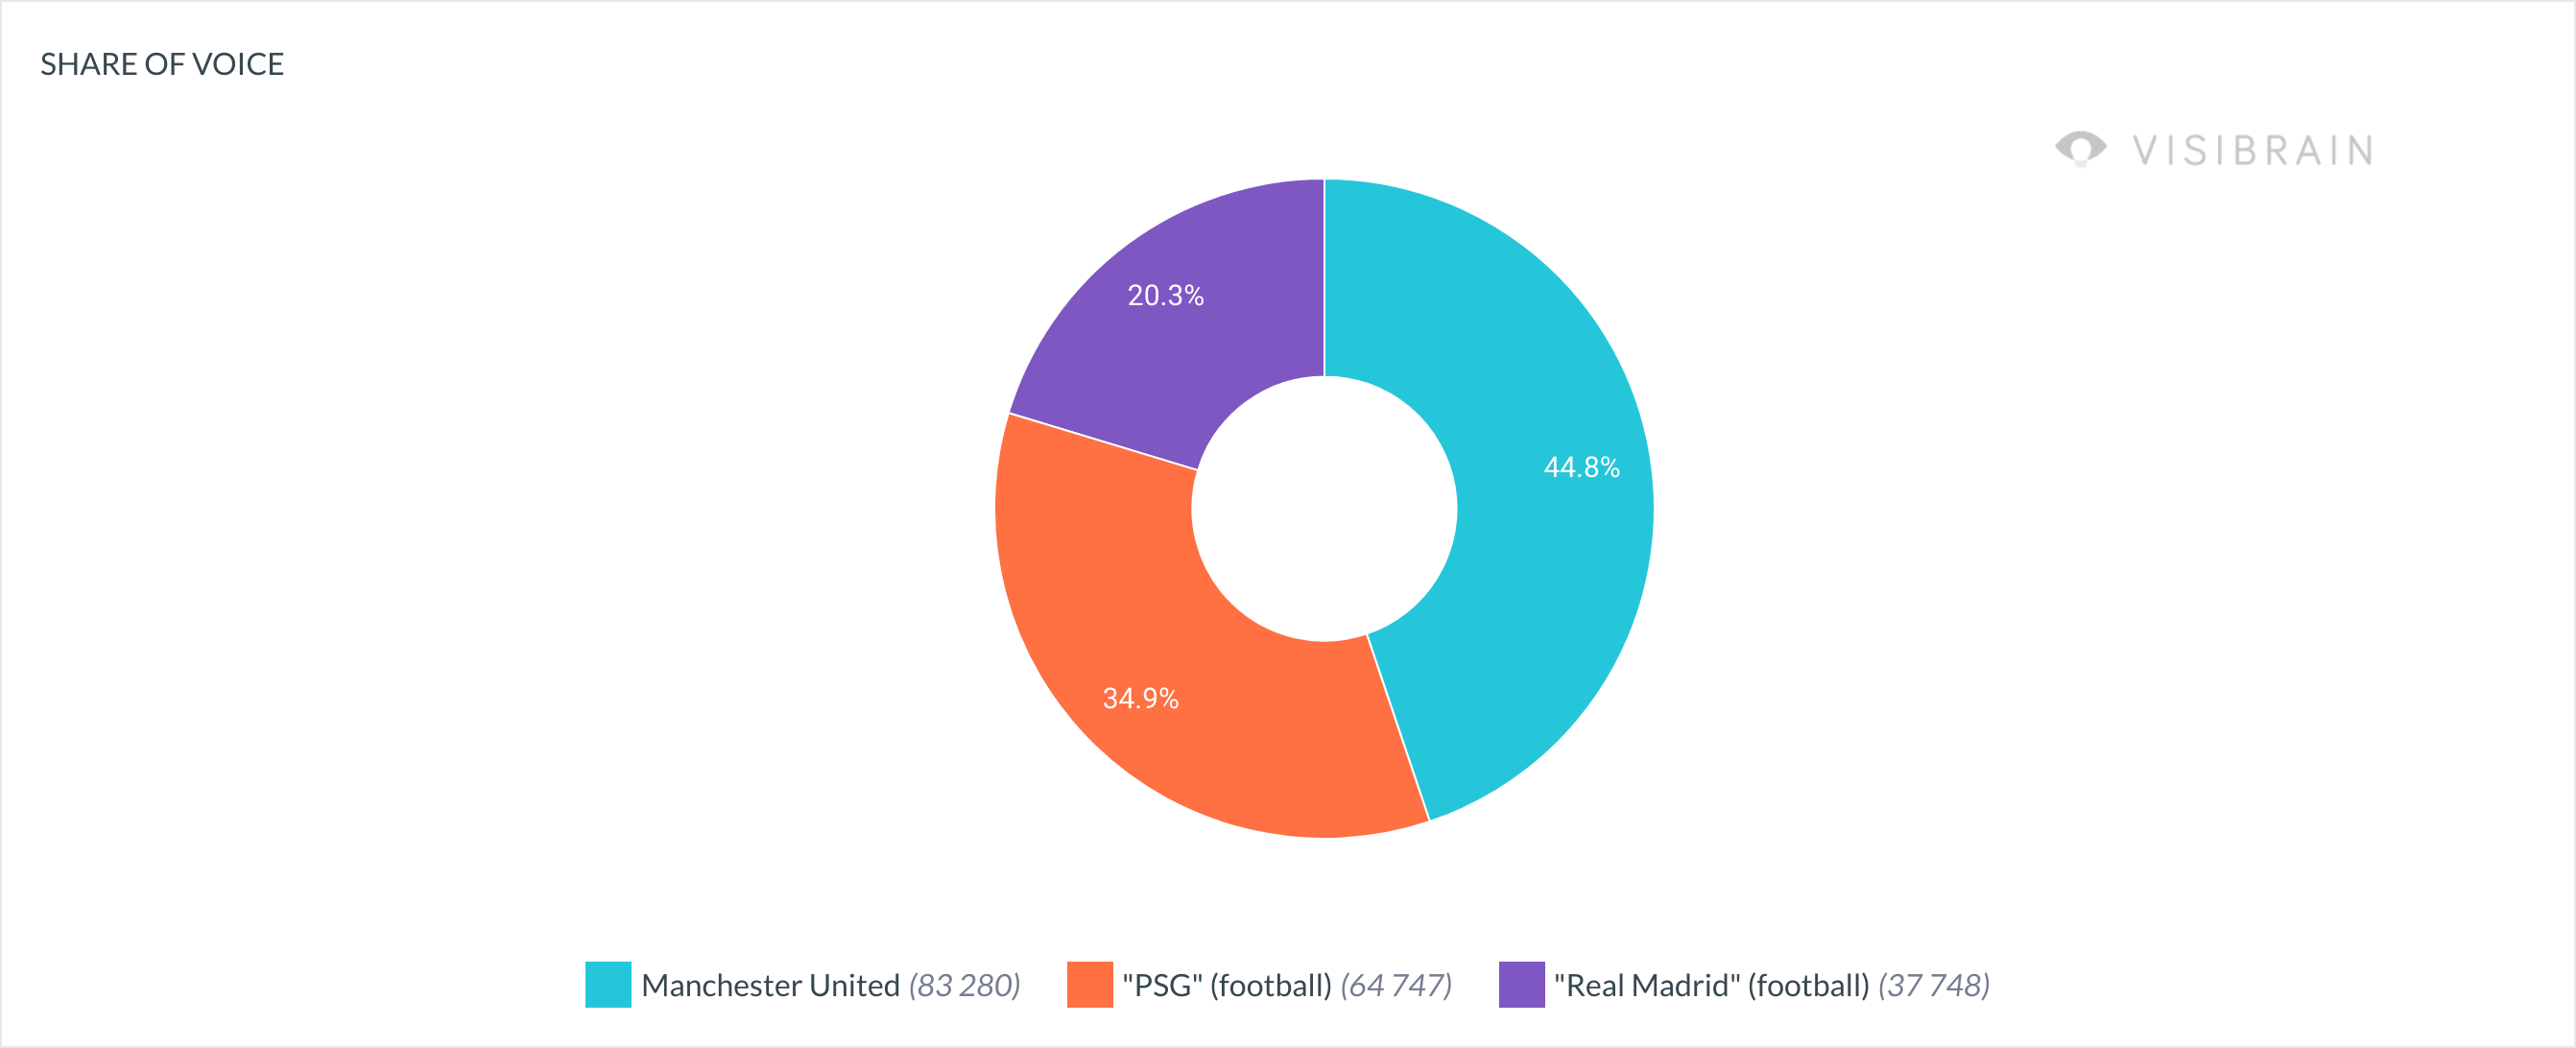
### Use the evolution curve, the bar chart or the Share of Voice pie chart
Are you looking to follow an evolution or do you want to compare different topics, brands, crisis... ? A solution for every need! The QuickTrends tool displays a curve by default, but it is possible to obtain the pie chart view or the bar chart to compare datas by clicking on the ***TRENDS/BARS/SHARE OF VOICE*** button in the upper right corner of the graph.
{% tabs %}
{% tab title="Timelines" %}
{% endtab %}
{% tab title="Share of Voice" %}
{% endtab %}
{% tab title="Bar chart" %}
{% endtab %}
{% endtabs %}
### Export your charts
You can export your charts in .png or .csv format by clicking on the menu in the upper right corner.