# Demographics
The Demographics tab enables you to access detailed analytics linked to the X (formely Twitter) accounts that have participated in the conversation you're monitoring on the defined period of time. \
You will find information on the job, gender, interests and localisation declared by the monitored X (formely Twitter) accounts.
**OVERVIEW**
This first page gives you access to a full overview of the demographic analysis. You will find: \
\- Gender distribution \
\- Verified accounts\
\- Job description word clouds\
\- Interests word clouds \
\- Map of localisation most declared by the X (formely Twitter) accounts
{% hint style="info" %}
You can click on any element of the page to apply a temporary filter on the data you are analysing. \
For example : Focus on verified accounts by clicking on that tab.
{% endhint %}
The menu on the left enables to access a detailed view of each KPI.
**LOCATION**
The Location tab enables you to access the list of countries / regions / cities declared by the X (formely Twitter) Accounts as a location from which they would be tweeting. \
Each list will be ranked by the number of posts registered as been posted from there. \
By clicking on any element (country, region or city) you can apply a temporary filter on your data.
{% hint style="info" %}
We take into account the originally declared localisation on the X (formely Twitter) biography and or the GPS localisation, when it has been accepted by the X (formely Twitter) Account. \
\
The location is inferred : \
If an account is registered as tweeting from London, it will be registered as tweeting from the UK.
{% endhint %}
**INTERESTS**
The Interests tab enables you to access the list of interest declared by the X (formely Twitter) accounts that have participated in the monitored conversation on the defined period. \
These interests are taken from the biographies of the monitored X (formely Twitter) accounts and are ranked by number of posts.
{% hint style="info" %}
You can click on any element of the list to apply a temporary filter to your monitored data. For example focusing on all the X (formely Twitter) accounts that are interested in art and that have been active on your subject.
{% endhint %}
**OCCUPATIONS**
The Occupations tab enable to access the list of job description declared by the X (formely Twitter) accounts that have participated in the monitored conversation on the defined period. \
These job descriptions are taken from the biographies of the monitored X (formely Twitter) accounts and are ranked by number of posts.
{% hint style="info" %}
You can click on any element of the list to apply a temporary filter to your monitored data. For example focusing on all the X (formely Twitter) accounts that have declared reporter as job description and that have been active on your subject.
{% endhint %}
**GENDER**
The Gender tab enables you to access the gender distribution for the X (formely Twitter) accounts that have participated in the monitored conversation on the defined period.
{% hint style="info" %}
This type of analysis can help you dive deeper into the data and give context to your findings :
For example, *"there are 57% of women who are tweeting about XXX"*
{% endhint %}
You can also access a view differentiating "Human" and "Others", the Others classification will often be linked to companies, media, bots ....
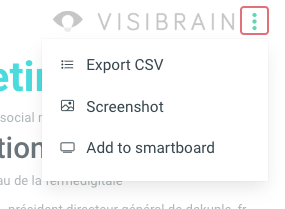
**EXPORTS**
Each view / list / analysis can be exported to CSV format or PNG format. By clicking on the "Action" option of each view.
You will also have the possibility to add directly the view / list / analysis to a [Smartboard](https://help.visibrain.com/~/revisions/Sg0jEnRI9hg61KE4OFRP/platform/smartboards).